📋 Executive Summary
- National Market Recalibration: The U.S. housing market is in a period of stabilization, termed the "Great Recalibration," with modest national price growth (1-1.2% forecast) and sales activity. The extreme volatility of recent years has subsided.
- Mortgage Rate Stability: Mortgage rates have stabilized in the low 6% range (around 6.09% for a 30-year fixed), providing a more predictable, albeit elevated, financing environment for homebuyers. This is expected to persist through 2026.
- A "Splitting" Market: A significant regional divergence defines the national landscape. The Northeast and Midwest exhibit strong demand and price growth due to severe inventory shortages, while the Sunbelt is cooling due to an oversupply from a pandemic-era construction boom.
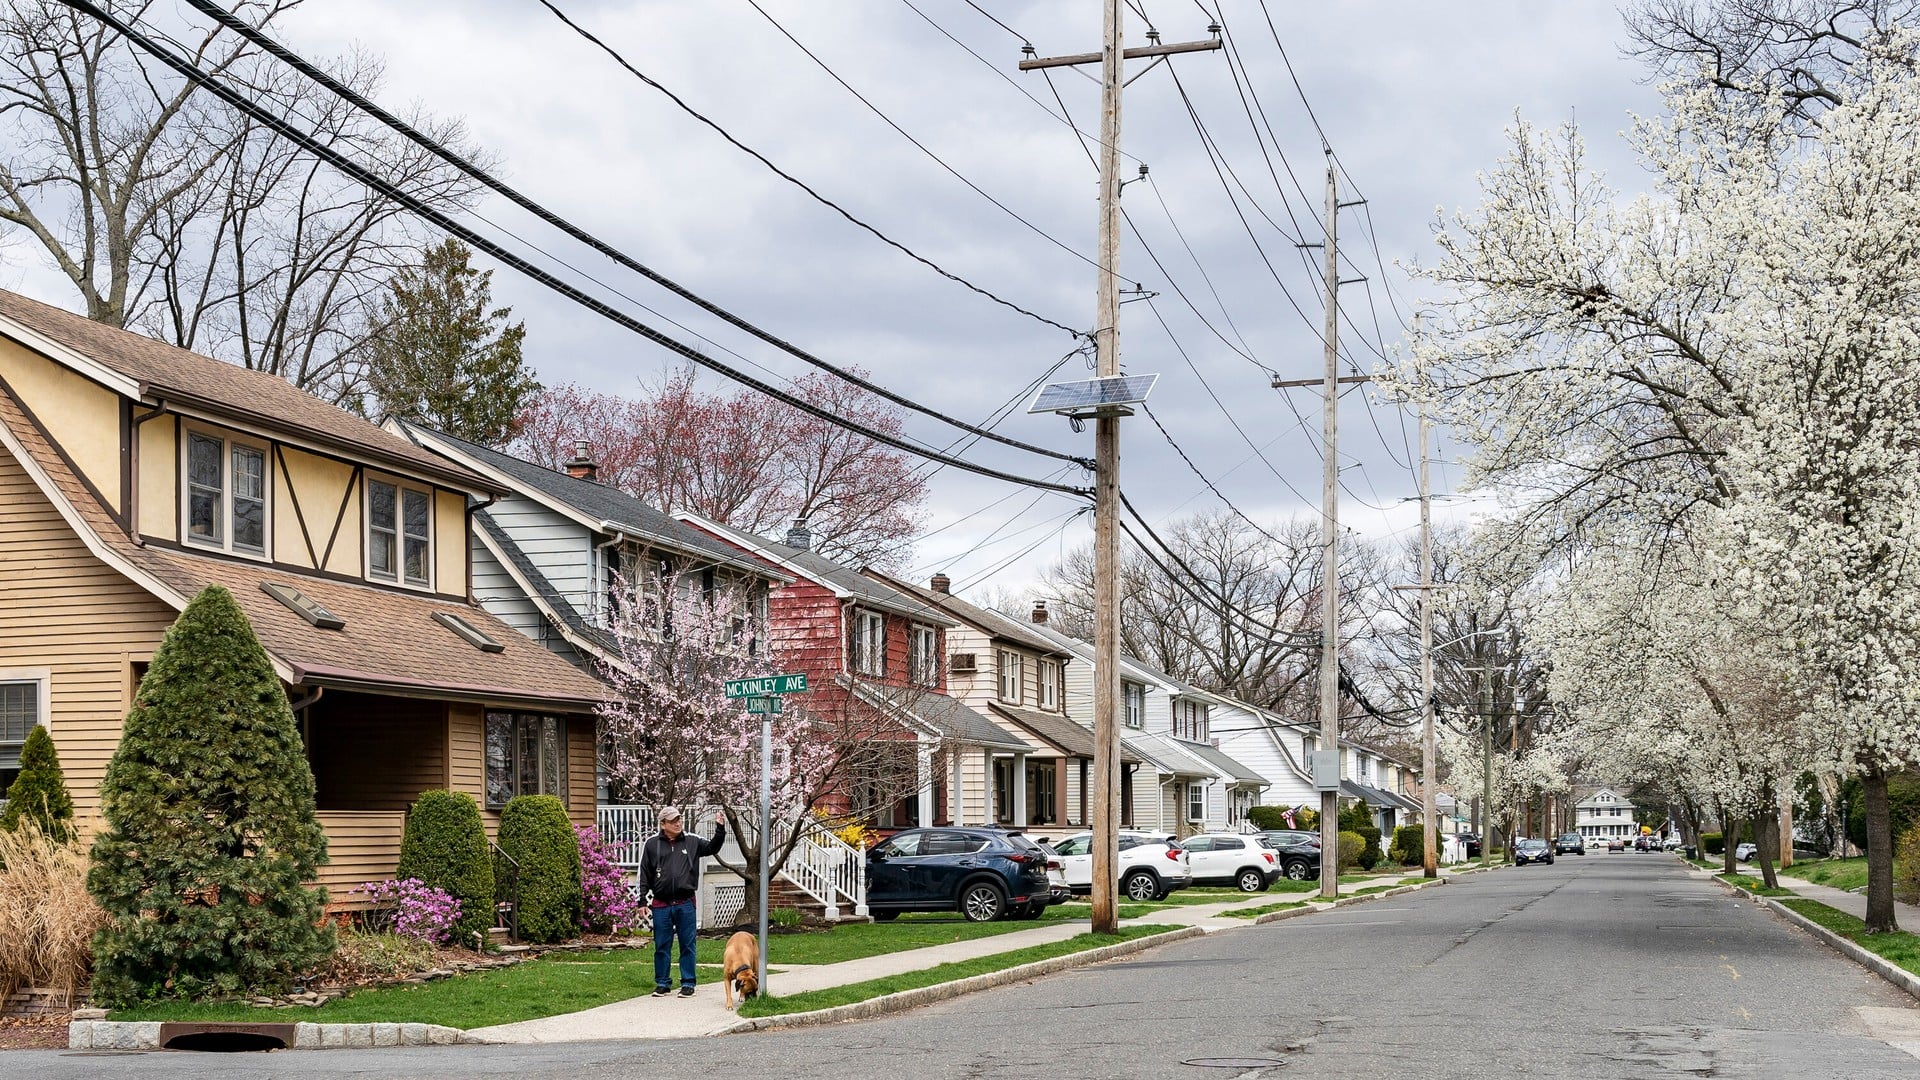
- New Jersey's Resilience: The New Jersey market mirrors the strong Northeast trend, characterized by a persistent inventory shortage (2.4-3 month supply), which supports prices and keeps the state in a firm seller's market. A market crash is considered highly unlikely.
- Bergen County's Segmented Market: Bergen County is experiencing a strategic recalibration, not a cooling. The market is segmented, with a critically low 1.4-month supply for single-family homes fueling competition, while the townhouse/condo market sees rising inventory (2.2-month supply), creating more buyer leverage.
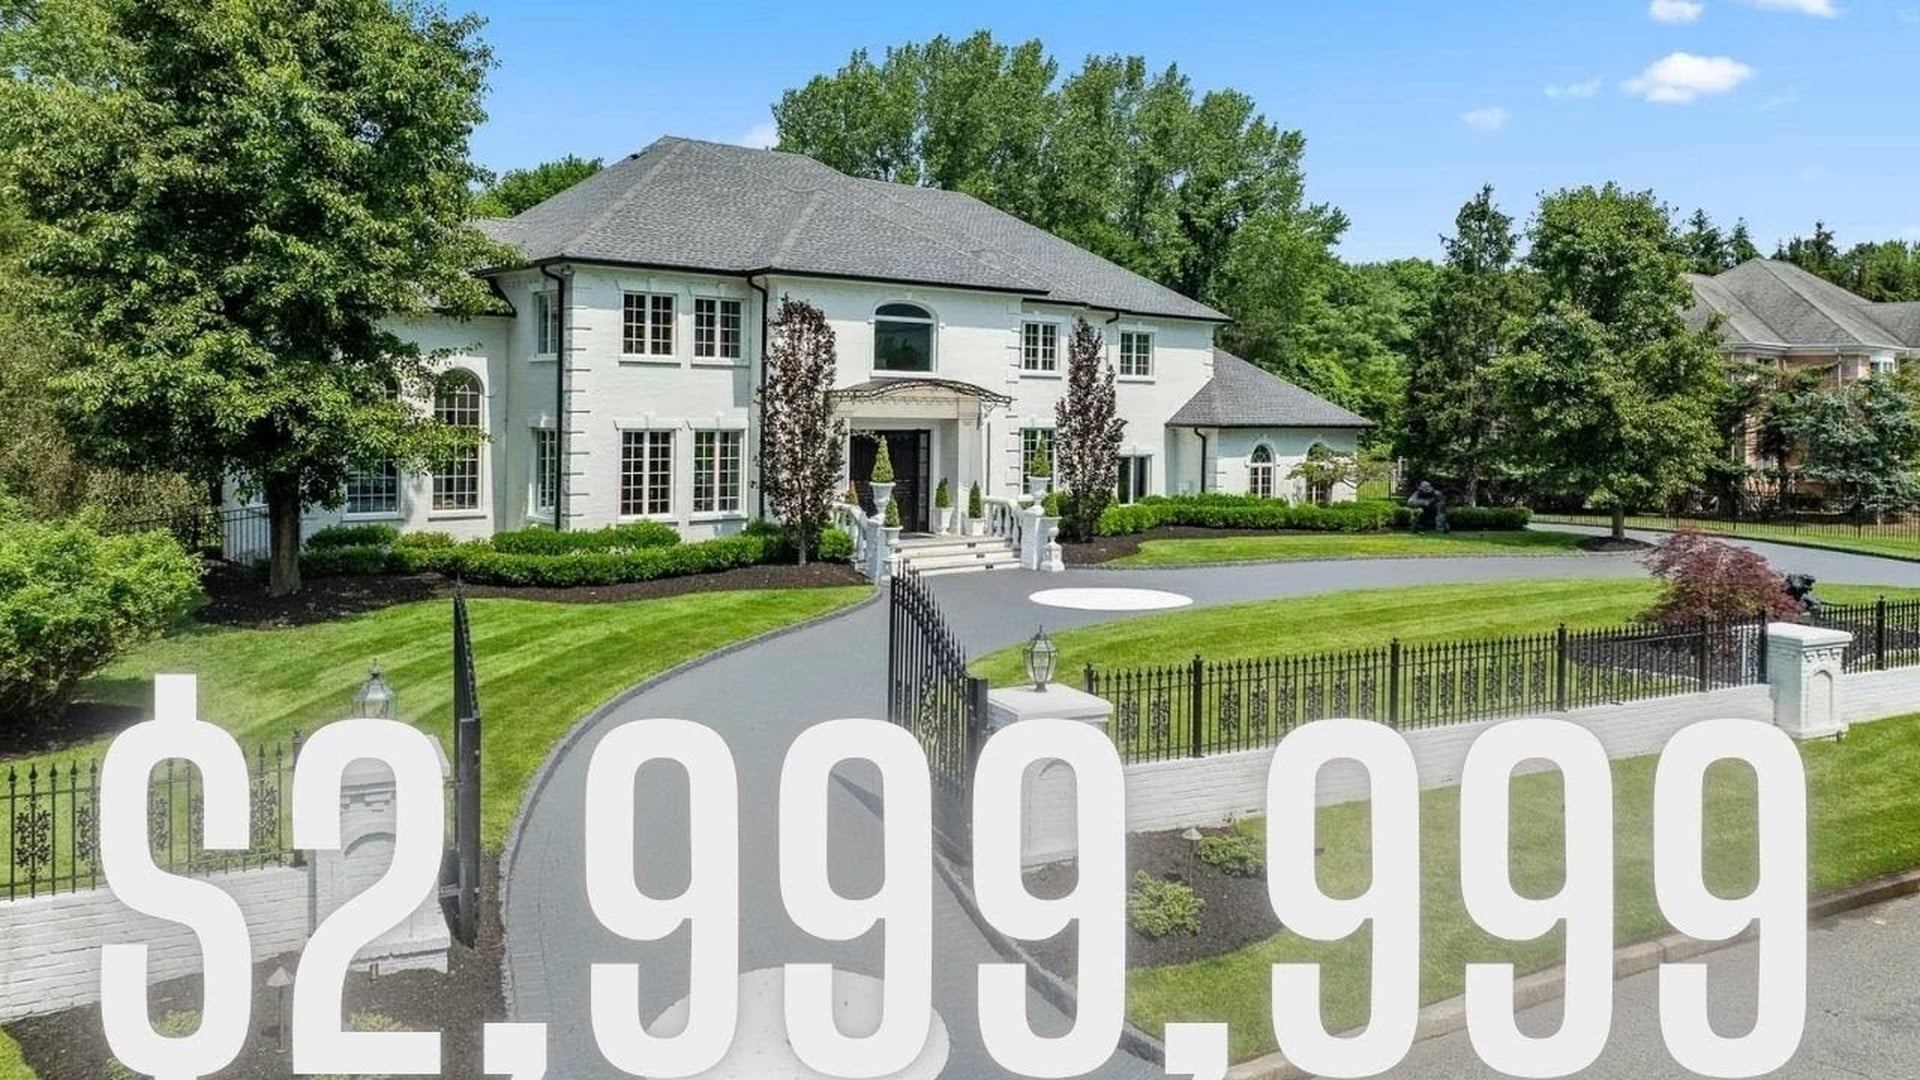
- Sustainable Price Growth Locally: In contrast to modest national forecasts, New Jersey projects 2-4% price growth for 2026. Bergen County's single-family homes are appreciating even faster (8.8% YoY), while the overall county forecast is a sustainable 1-3% for the year.
- Strategy Over Speed: The market has shifted from a focus on speed to a focus on strategy. For sellers, precise pricing and impeccable presentation are paramount. For buyers, preparedness and strategic negotiation are key, especially in segments with growing inventory.

🏦 Mortgage Rates
Mortgage rates have continued their trend of stabilization in early 2026, providing a more predictable, albeit still elevated, cost environment for homebuyers. As of the week ending February 12, 2026, Freddie Mac reported the average 30-year fixed-rate mortgage (FRM) at 6.09%, a slight decrease from the prior week. This represents a significant improvement from a year ago when the 30-year FRM was 6.87%.
Expert consensus suggests that rates will likely remain in this low-6% range for the remainder of 2026, with major housing authorities projecting an average between 6.1% and 6.3%. This stability is attributed to a weakening but still resilient labor market and moderating inflation, which have allowed the Federal Reserve to hold interest rates steady after making three cuts in late 2025. While the Fed has adopted a "wait-and-see" approach, the market anticipates that further signs of economic cooling could lead to additional, modest rate cuts later in the year.
📦 Housing Inventory
Housing inventory remains a central theme, with a persistent shortage continuing to constrain sales and support prices, even as conditions slowly improve. Nationally, total housing inventory at the end of January 2026 stood at 1.22 million units, a 3.4% increase from one year prior but still only a 3.7-month supply at the current sales pace. A balanced market is typically considered to have a 4- to 6-month supply.
The inventory story is highly regional. The Northeast and Midwest face a severe and chronic shortage of homes for sale, with active listings in some hot markets still 74% below pre-pandemic levels. This scarcity is a primary driver of strong price appreciation. In stark contrast, the Sunbelt and West—many markets in Florida, Texas, and Arizona—are grappling with an oversupply of homes from a pandemic-era construction boom, which is now putting downward pressure on prices. Nationally, new single-family housing starts are projected to have their weakest year since 2019 as builders pull back on new projects to move existing inventory, often with incentives like mortgage-rate buydowns.
💵 Pricing & Affordability
Home prices in early 2026 reflect the market's rebalancing act, characterized by modest national growth and significant regional variations. The National Association of Realtors (NAR) reported a median existing-home price of $396,800 in January 2026, a 0.9% increase from the previous year. Forecasts for the full year project continued modest appreciation, with Zillow predicting a 1.2% increase and Redfin forecasting a 1% rise.
A key positive development is the improvement in affordability. For the first time in years, wage growth is outpacing home price growth. This, combined with slightly lower mortgage rates, is slowly reducing the share of median household income required for a typical mortgage payment. However, affordability remains a profound challenge in high-cost regions like the Northeast, where prices continue to rise faster than wages.
📊 Market Conditions & Sales Activity
The pace of the housing market has slowed considerably. Existing-home sales fell 8.4% in January 2026 to a seasonally adjusted annual rate of 3.91 million, a drop attributed to severe weather and ongoing supply constraints. Despite the monthly dip, total sales for 2026 are forecast to increase by 4.3% over 2025 as pent-up demand is unlocked by improving affordability.
Homes are taking longer to sell, with the median days on market at 46 days in January, up from 41 days a year prior. This slowdown is creating a more favorable environment for buyers, who now have greater negotiating power. First-time homebuyers are playing a significant role, accounting for 31% of sales in January.
🌎 Notable Regional Insights
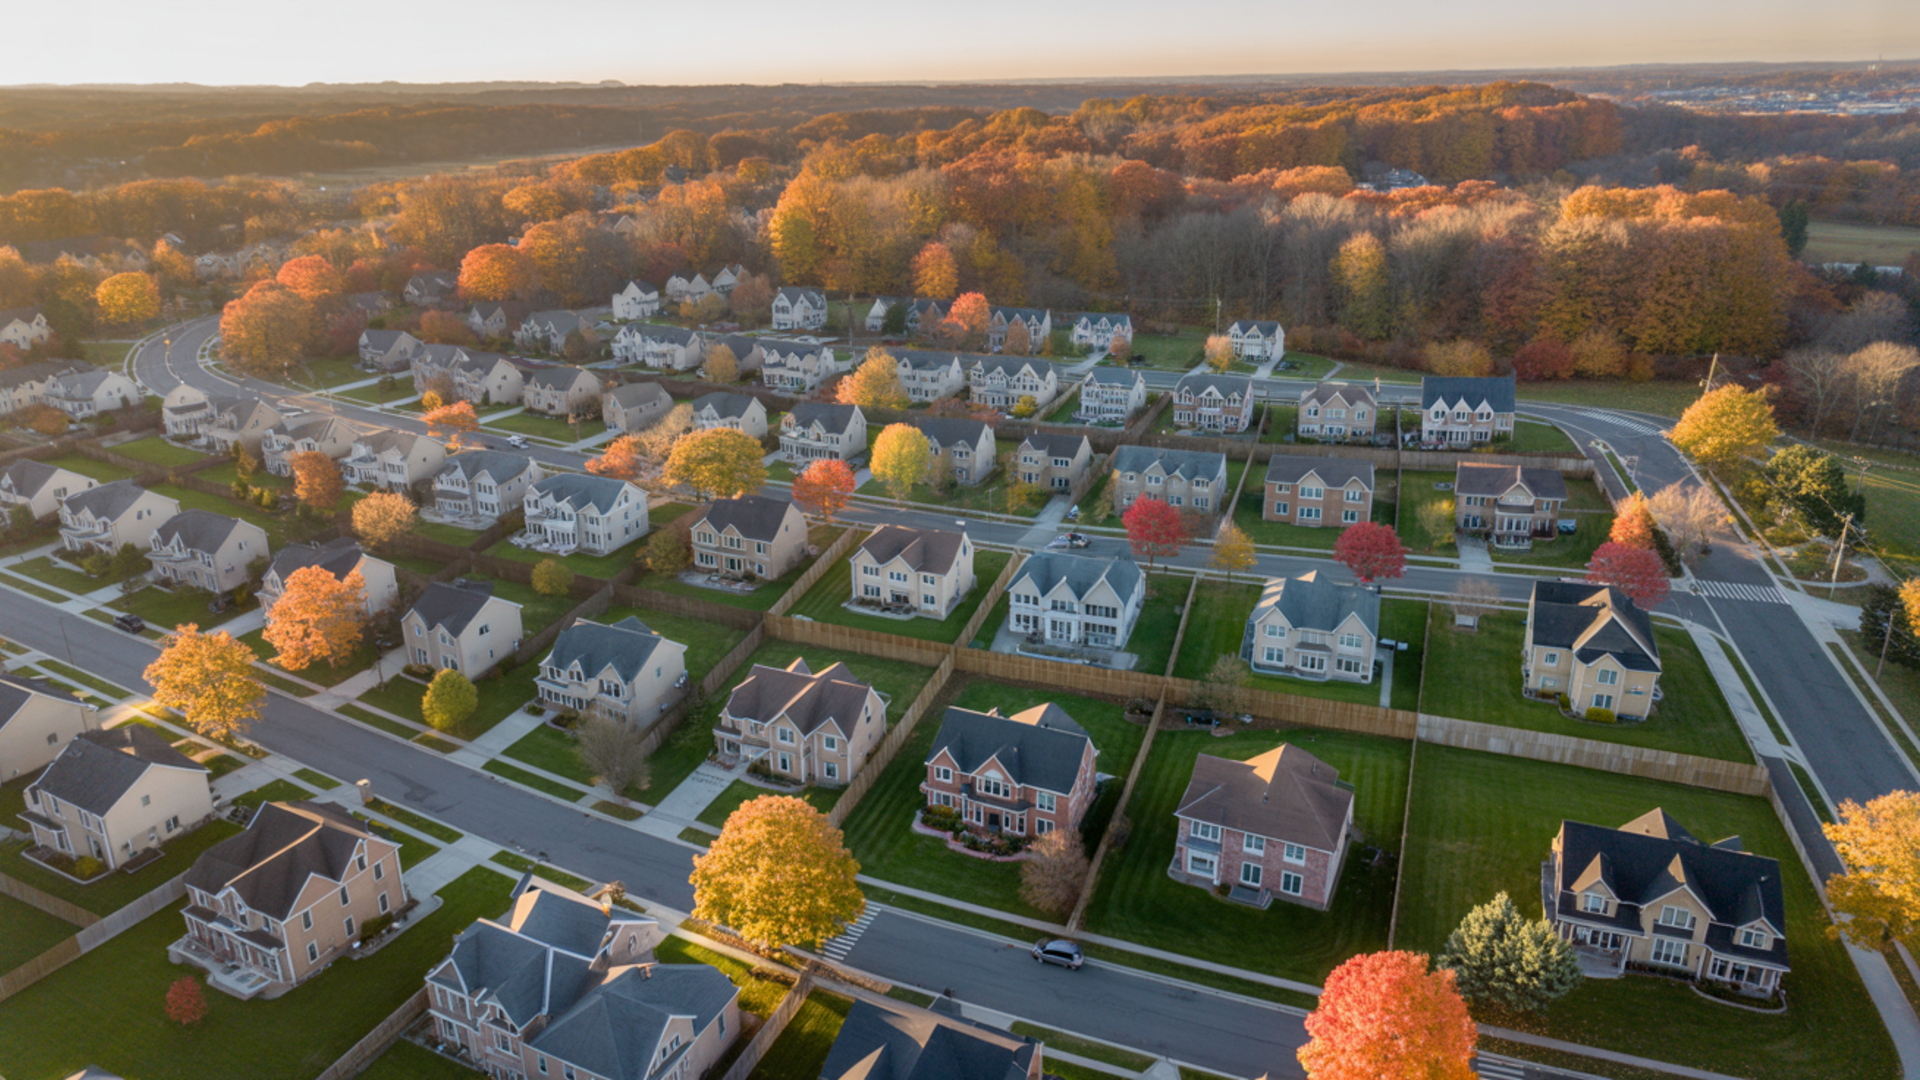
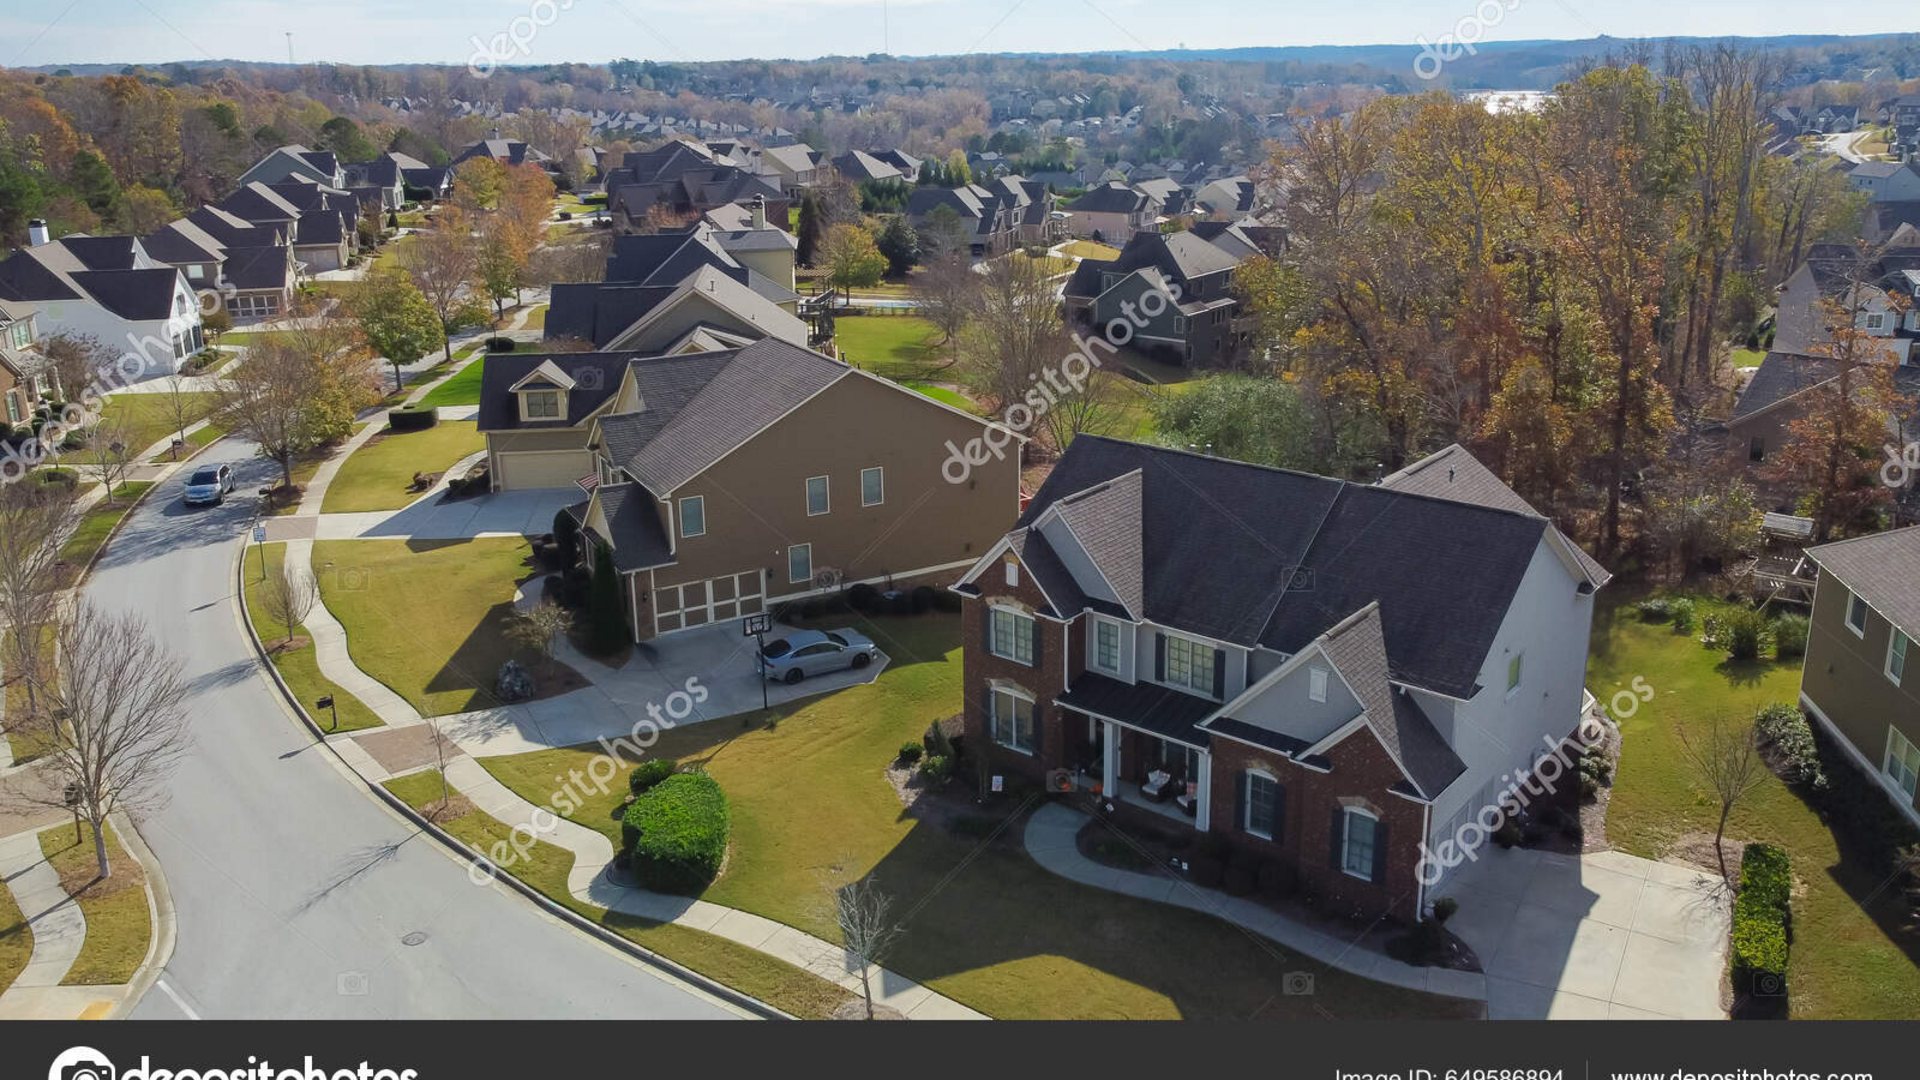
Northeast: The nation's most robust housing market, driven by a "great value migration" of buyers from expensive coastal hubs to mid-sized cities like Hartford, CT, and Rochester, NY. Severe inventory shortages are fueling strong price appreciation. This region continues to favor sellers with limited supply and high demand.
Midwest: Similar to the Northeast, this region is characterized by tight inventory and steady price growth, with its relative affordability attracting first-time homebuyers looking for value and space.
Sunbelt: Pandemic-era boomtowns in Florida and Texas are undergoing a significant cooling period, with an oversupply of housing leading to price stabilization and modest declines in some areas. Buyers in these markets now have significantly more leverage.
West Coast: This region presents a mixed but generally moderating picture. While affordability remains a profound challenge, some markets are seeing a gentle recovery, with California projected to see a modest 3.6% rise in its median home price for 2026.

👨👩👧👦 First-Time Buyer Landscape
The 2026 market presents a unique window of opportunity for first-time homebuyers. For the first time in years, wage growth is outpacing home price growth, slowly improving the affordability equation. Combined with stabilized mortgage rates and longer days on market, buyers have more breathing room than they've had since 2020.
First-time buyers are gravitating toward the Midwest and Northeast for relative affordability and value. The median age of first-time buyers has risen to 38 years old, reflecting the prolonged savings period required in high-cost markets. Down payment assistance programs and FHA loans remain critical tools for market entry.
📉 Affordability Improvement
A key positive development is the gradual improvement in housing affordability. After years of deterioration, the share of median household income required for a typical mortgage payment is slowly declining. This trend is expected to continue through 2026.
Key affordability factors:
• Wage growth of 4.2% outpacing price growth of 1.2%
• Mortgage rates stable in low-6% range vs. 7%+ in 2023
• Increased inventory giving buyers negotiating leverage
• Builder incentives including mortgage rate buydowns
By year's end, Zillow projects 20 major markets will return to affordability—the most since 2022.
🏗️ New Construction Trends
New single-family housing starts are projected to have their weakest year since 2019 as builders strategically pull back on new projects to move existing inventory. This restraint is most pronounced in the oversupplied Sunbelt markets where builders are offering significant incentives—including mortgage-rate buydowns to as low as 5.25%—to attract buyers.
In supply-constrained Northeast markets like New Jersey, new construction remains limited due to strict zoning regulations, land scarcity, and high development costs. This structural constraint is a key reason why prices remain firm despite national moderation. For buyers seeking new construction, the limited options command premium pricing, but may offer better value in the long term given quality and energy efficiency standards.

🏠 Homeownership by Generation
Generational shifts are reshaping housing demand patterns across the nation. Understanding these demographics helps predict future market trends:
Baby Boomers (1946-1964): Hold the largest share of housing wealth. Many are "aging in place" rather than downsizing, contributing to inventory shortage. The Stay NJ program may encourage more senior listings over time.
Gen X (1965-1980): Peak earning years. Active in the move-up market, driving demand for larger single-family homes in top school districts.
Millennials (1981-1996): Now the largest home-buying generation. Delayed homeownership due to student debt and affordability challenges. Strong demand for entry-level homes and condos.
Gen Z (1997-2012): Entering the market. Prioritize flexibility, sustainability, and technology. Expected to drive condo and townhouse demand.
📊 Buyer Demographics
Millennials now represent the largest share of homebuyers nationally. Gen Z is beginning to enter the market, while Baby Boomers remain active in both selling and downsizing segments.
💰 Wealth Building Through Real Estate
Real estate remains the primary wealth-building vehicle for American households. In 2026, homeownership continues to deliver significant financial benefits despite elevated rates:
Equity Accumulation: The average U.S. homeowner has gained approximately $147,000 in equity since 2020. In high-appreciation markets like Bergen County, gains are even higher—approaching $200,000+ for long-term owners.
Forced Savings: Each mortgage payment builds ownership stake, creating disciplined wealth accumulation that renters don't achieve. Even at 6% rates, monthly principal paydown contributes to net worth.
Tax Advantages: Mortgage interest and property tax deductions (within SALT limits) continue to benefit homeowners. Capital gains exclusions ($250K single/$500K married) protect most primary residence sales from taxation.
Inflation Hedge: Real property values historically keep pace with or exceed inflation, protecting purchasing power. Fixed-rate mortgages lock in housing costs while rents continue rising.